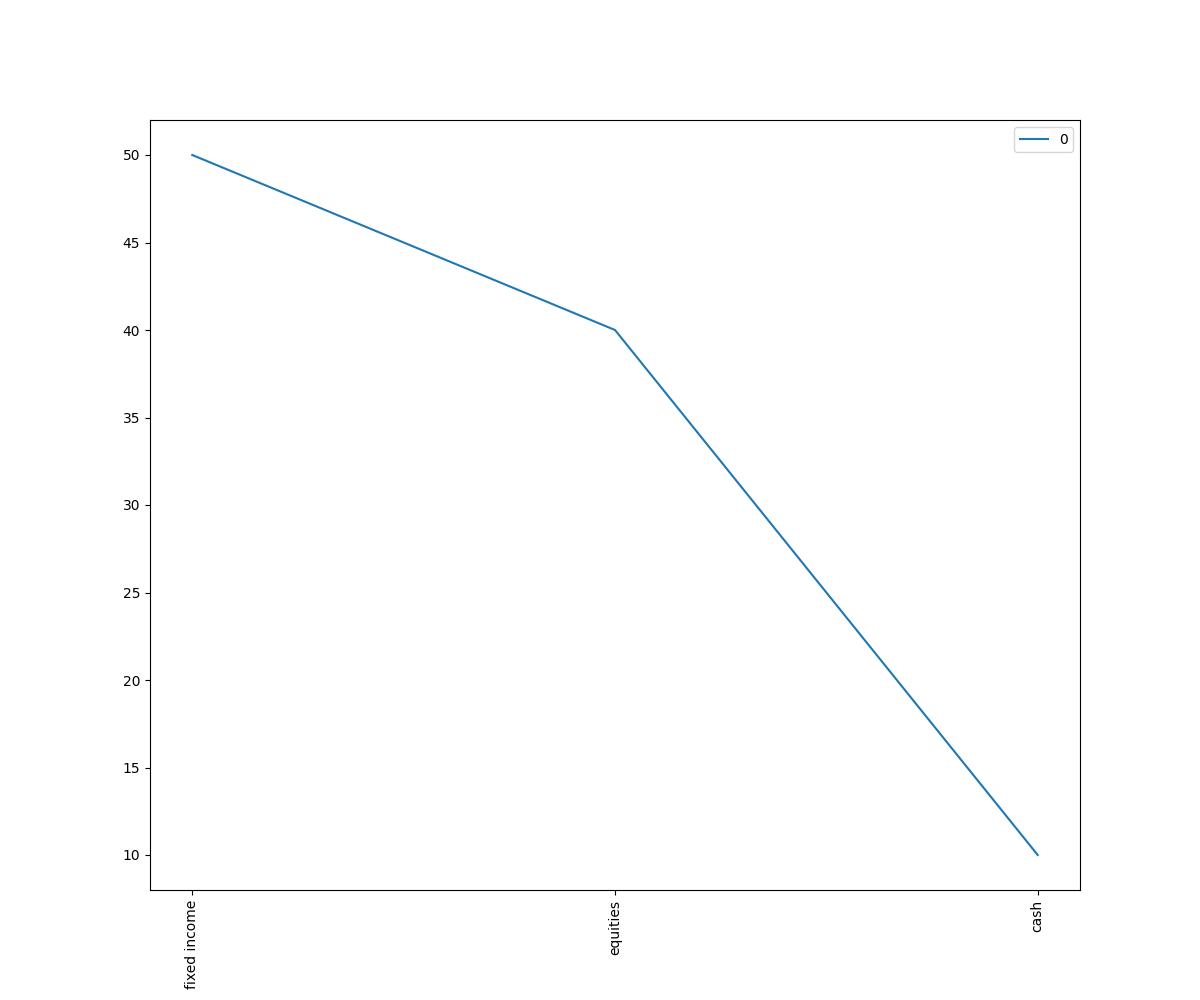
Build A Pie Chart With 3 Parametres: 1. Fixed Income - 50% 2. Equities - 40% 3. Cash - 10%
From the PlotGPT AI Reports
To build a pie chart with the given parameters, you can use the "matplotlib" library in Python. Here's an example code to create a pie chart using these values: ```python import matplotlib.pyplot as plt # Data data = { 'fixed income': 50, 'equities': 40, 'cash': 10 } # Pie chart labels = data.keys() sizes = data.values() explode = (0, 0, 0.1) # Explode the smallest slice fig1, ax1 = plt.subplots() ax1.pie(sizes, explode=explode, labels=labels, autopct='%1.1f%%', startangle=90) # Aspect ratio ensures that pie is drawn as a circle. ax1.axis('equal') # Title plt.title('Investment Allocation') # Show the pie chart plt.show() ``` Make sure you have the "matplotlib" library installed (`pip install matplotlib`) to run this code successfully.