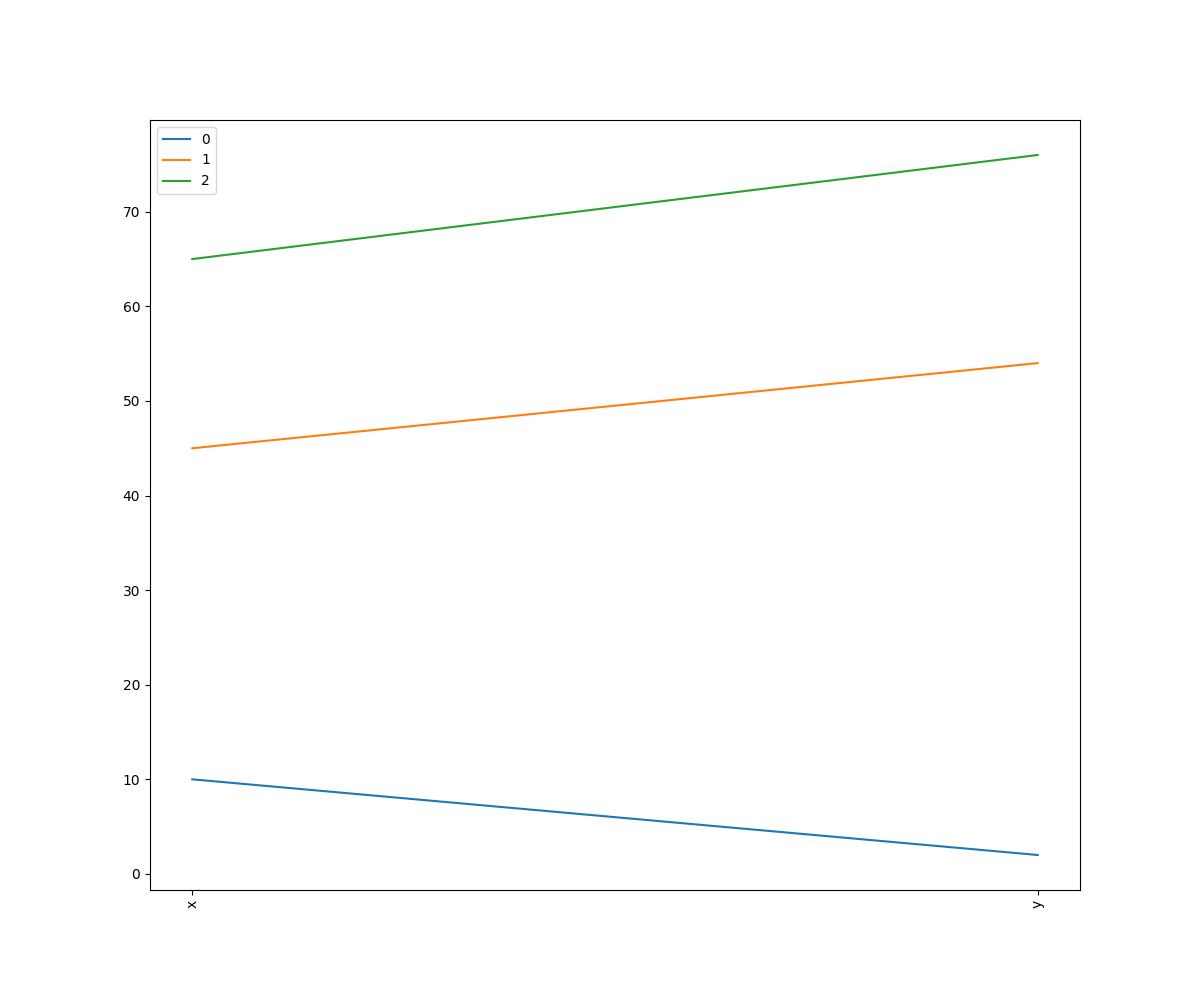
Show Line Plot Based On X = 10, 45, 65, Y = 2, 54, 76
From the
PlotGPT
AI Reports
{ "x": [10, 45, 65], "y": [2, 54, 76] }