Show Scatter Plot Based On X = 10, 45, 65, Y = 2, 54, 76
From the PlotGPT AI Reports
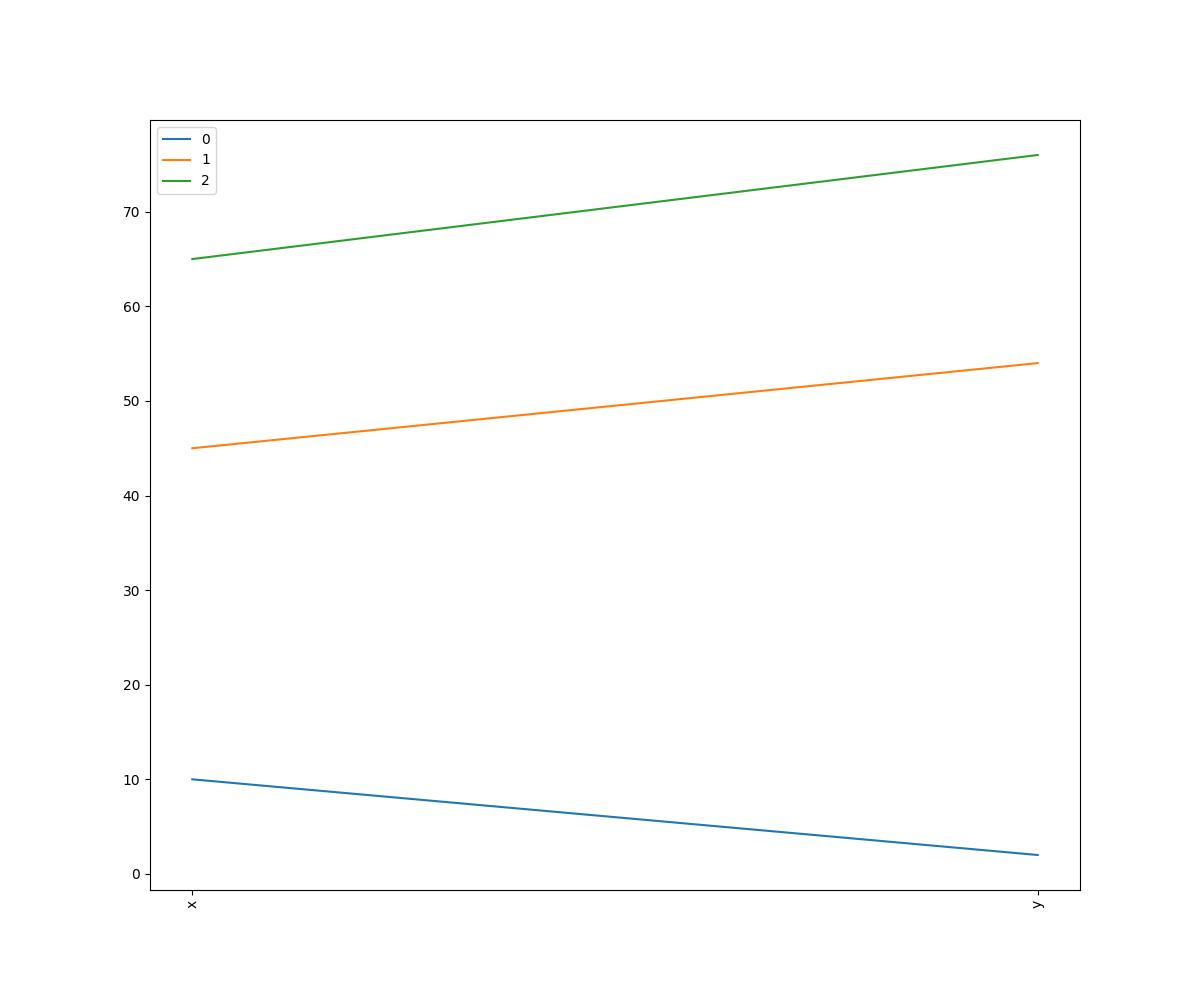
To show a scatter plot based on the given data in Python, you can use the matplotlib library. Here's an example of how you can accomplish this: ```python import matplotlib.pyplot as plt data = { "x": [10, 45, 65], "y": [2, 54, 76] } plt.scatter(data['x'], data['y']) plt.xlabel('x') plt.ylabel('y') plt.title('Scatter Plot') plt.show() ``` This code will create a scatter plot with the x-values on the x-axis and the y-values on the y-axis. The labels and title are also included for clarity.